The Connecticut Coastal Hazards Viewer is an online mapping tool designed to allow users access to several pertinent suites of data for coastal Connecticut. Presented here are data representing sea level rise, high-resolution coastal elevation, hurricane storm surge, coastal erosion, environmental observations such as tides, water quality, waves and currents and more. Visit the CT DEEP information on the Coastal Hazards Mapping Tool page for more information.
The data presented here are intended for planning and/or illustrative purposes only and should not be used for determining actual jurisdictional boundaries, making regulatory decisions, developing engineering analyses/designs, etc. These maps and the data contained in them are not guaranteed to be correct or complete and conclusions drawn from such information are the sole responsibility of the user. Reasonable attempts have been made to ensure that this data and documentation is accurate and reliable; however neither the Connecticut Department of Energy and Environmental Protection, nor its partners assumes liability for any damages caused by inaccuracies in this data or documentation, or as a result of the failure of the data or software to function in a particular manner. NOAA, The Connecticut Department of Energy and Environmental Protection, and the University Of Connecticut Department Of Marine Sciences make no warranty, expressed or implied, as to the accuracy, completeness, or utility of this information, nor does the fact of distribution constitute a warranty.
LIS Environmental Observation Locations
Hurricane Evacuation Zones (2014)
Hurricane Surge Inundation (2012)
Shoreline Change: Short Term and Long Term
Sea Level Rise: Mean High Water
Sea Level Rise: Average Monthly Max
The Coastal Area includes the land and waters that lie within the Coastal Area as defined by Connecticut General Statute (C.G.S.) 22a-94(a). Activities and actions conducted within the coastal area by Federal and State Agencies must be consistent with all of the applicable standards and criteria contained in the Connecticut Coastal Management Act (C.G.S. 22a-90 to 22a-113).
The Coastal Boundary is a subset of the Coastal Area that represents an area within which activities regulated or conducted by coastal municipalities must be consistent with the Coastal Management Act.
![]() Zone A: DEFINTION
Zone A: DEFINTION
Zone B: DEFINITION
This information includes Hurricane Surge Inundation areas for category 1 through 4 hurricanes striking the coast of Connecticut with a peak hurricane surge arriving at high mean water. The hurricane surge elevation data used to define these areas were calculated by the National Hurricane Center using the Sea Lake and Overland Surge from Hurricanes (SLOSH) Model. The SLOSH model hurricane surge elevations have an accuracy of +/- 20 percent.
The hurricane surge inundation areas depict the inundation that can be expected to result from a worst case combination of hurricane landfall location, forward speed, and direction for each hurricane category. This layer was developed to assist emergency management officials in hurricane preparedness and operations.
 Legend
The visualization data depicts estimates of inundation due to sea level rise across all of Connecticut towns with direct frontage on Long Island Sound (and Fisher's Island Sound).
The scenarios shown here are based on Light Detection and Ranging (Lidar) elevation data collected in 2004 and 2006 by the Federal Emergency Management Agency (FEMA) and processed by DEEP. Each reflects what inundation might look like at one of two tide levels: mean high water (MHW) or the average monthly maximum water level (AMM). AMM attempts to quantify the maximum extent of tidally influenced water levels.
The scenarios are taken from both global and regional estimates, each associated with a particular time frame. In doing so, they present a way to look at short, medium and long-term potential effects. The table below describes the sea level rise value, its source, and applicable time frame.
| Sea Level Rise(in/ft) | Approximate Relation to Scientific Data | Planning Horizon |
|---|---|---|
| 6 in / 0.5 ft | Average 2004 Environmental Defense Hi/Low emissions | 2020 |
| 12 in / 1.0 ft | Average 2004 Environmental Defense Hi/Low emissions | 2050 |
| 18 in / 1.5ft | 2004 Environmental Defense High Emissions | 2050 |
| 24 in / 2.0 ft | 2007 IPCC High Emissions | 2100 |
| 36 in / 3.0 ft | 2004 Environmental Defense High Emissions | 2080 |
| 60 in / 5.0 ft | n/a – gap filler | n/a |
| 79 in / 6.6 ft | Pfeffer et al 2008 | 2100 |
In addition to depicting the extent of inundation, each layer also provides the depth (in units relative to North American Vertical Datum of 1988, NAVD88) between the inundation level and the ground as depicted by the Lidar data. Thus, identifying any location will provide a sense of "how deep" the water may be. Each location in the inundation layers generalizes a 3ft by 3ft area on the ground.
The 2006 Coastal Connecticut 3ft Digital Elevation Model (DEM) identifies the elevation of the ground at any given point within Connecticut's coastal boundary and provides a graphic representation of bare earth topography. The elevation data spans the approximate extent of the 100-year flood zone as defined by the FEMA.
The layer is based on information from bare-earth Lidar elevation data collected and compiled during 2004 and 2006. In the spring and summer of 2004 data was collect for towns with frontage on the Connecticut River. In December 2006 data was collected for all towns without frontage on the Connecticut River. Each 3ft by 3ft cell, or pixel, in the raster has a single elevation value representing the height of the ground in inches NAVD88.
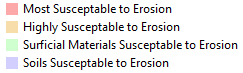
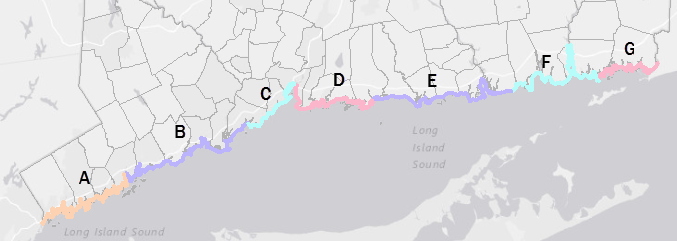
Connecticut Erosion Susceptibility is a 1:24,000-scale, polygon feature-based layer that was developed as a predictive tool to show areas most susceptible to terrace escarpment type erosion. The layer compiled from the soils and quaternary geology data layers and was field tested during October-December, 2005. The layer does not represent eroding conditions at any one particular point in time, but rather base or general conditions which can be accounted for during planning or management strategies. The layer includes four types of areas susceptible to erosion. Areas outside of the mapped polygons can be considered less susceptible to erosion.
Erosion Susceptibility
 Legend
Attributes
Erosion Susceptibility Sites
 Legend
Attributes
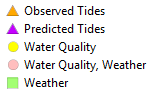
The LIS Environmental Observations layer provides the location of monitoring devices at a particular point in time. The devices are orchestrated by three groups.
Long Island Sound Integrated Coastal Observing System (LISICOS) provides environmental information ranging from weather, water quality, waves, and currents. NOAA Center for Operational Oceanographic Products and Services (CO-OPS) provides the national infrastructure, science, and technical expertise to monitor, assess, and distribute tide, current, water level, and other coastal oceanographic products and services. US Army Corps of Engineers New England District (ACOE-NED) is responsible for managing the Corps' civil works and military program responsibilities in a region that includes Connecticut.
 Legend
Attributes
Shoreline change is separated into Short Term and Long Term. Short Term covers 2983-2006 and Long Term covers 1880-2006. Visit the Connecticut Shoreline Change webpage at Connecticut Sea Grant for a complete report and data download.
The following exist in BOTH the Short Term and Long Term versions of the layers. The attribute definitions are the same while the values differ.
Transects
![]() Legend
Legend
Attributes
Net Shoreline Movement (NSM) is the total distance between the oldest and youngest shorelines.
Legend
Attributes
End Point Rates (EPR)
Legend
Attributes
CT Shorelines
Short term - shorelines represented for 1980s, 1990s and 2000s.
Long term - shorelines represented every decade from 1880 to 2000s.
Shoreline Change Envelope (SCE) - The shoreline change envelope reports a distance, not a rate. The SCE is the distance between the shoreline farthest from and closest to the baseline at each transect. This represents the total change in shoreline movement for all available shoreline positions and is not related to their dates
Net Shoreline Movement (NSM)- The net shoreline movement reports a distance, not a rate. The NSM is associated with the dates of only two shorelines. It reports the distance between the oldest and youngest shorelines for each transect.
Total Cast Distance (TCD) - running total of transect case lengths.
End Point Rate (EPR) - net shoreline movement divided by the time elapsed. Reported in meters per year.
Linear Regression Rate (LRR) - A linear regression rate-of-change statistic can be determined by fitting a least-squares regression line to all shoreline points for a particular transect. The regression line is placed so that the sum of the squared residuals (determined by squaring the offset distance of each data point from the regression line and adding the squared residuals together) is minimized. The linear regression rate is the slope of the line. The method of linear regression includes these features: (1) All the data are used, regardless of changes in trend or accuracy, (2) The method is purely computational, (3) The calculation is based on accepted statistical concepts, and (4) The method is easy to employ (Dolan and others, 1991). However, the linear regression method is susceptible to outlier effects and also tends to underestimate the rate of change relative to other statistics, such as EPR (Dolan, and others, 1991; Genz and others, 2007)
Regression R-squared statistic (LR2) - The R-squared statistic, or coefficient of determination, is the percentage of variance in the data that is explained by a regression. It is a dimensionless index that ranges from 1.0 to 0.0 and measures how successfully the best-fit line accounts for variation in the data. In other words, it reflects the linear relationship between shoreline points along a given DSAS transect..
Standard Error of the Estimate (LSE) - The standard error of the estimate measures the accuracy of the predicted values of y by comparing them to known values from the shoreline point data.
Zone - the Geologic Zones developed by Arthur Bloom in 1967 to describe the CT coastline. Used in previous shoreline change analysis by CTDEEP ca. 1980: http://www.ct.gov/deep/lib/deep/long_island_sound/coastal_hazards/plngreport29.pdf
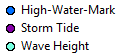
USGS Peak Locations are records from sensors that weren’t lost and functioned properly.
 Legend
Attributes
USGS High Water Marks are the results of the USGS post-storm survey effort, which included independent high-water mark locations that were surveyed in relation to NAVD88.
![]() Legend
Legend
Attributes
USGS Storm Sensor Network shows where USGS deployed a temporary monitoring network of water-level sensors during October 2012 to record the timing, areal extent, and magnitude of inland hurricane storm tide and coastal flooding generated by Hurricane Sandy.
 Legend
Attributes
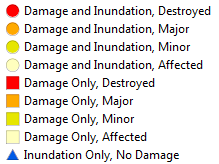
A point was placed on every building in the Sandy inundation zone (circles) (319,575 total buildings). Additional buildings were included that were outside of the inundation zone but damage determinations were identified using visible aerial imagery (squares).
In cases of overlap, the visible aerial imagery damage determination (15,256) overruled the inundation based damage assessment.
 Legend
Inundation means the presence of flood water.
Damage values:
Assessments are made from NOAA aerial imagery, Civil Air Patrol photographs, and media images captured 29-Oct, 30-Oct, 31-Oct, 01-Nov, 02-Nov, 03-Nov, 04-Nov, 05-Nov 2012.
There are several iterations of these data for CT (versions 16 through 27) spanning time between 11/06/2012 through 11/21/2012.
Attributes: (for all layers)
This product was assembled for FEMA by New Light Technologies (NLT) and ImageCat.
The NOAA Hurricane Research Division produced surface wind analysis of tropical cyclones from 1993 - 2013 as part of the H*Wind Project. H* Wind is the Hurricane Research Division Real-time Hurricane Wind Analysis System.
H* Wind Analysis-Max Speed & H* Wind Analysis- Max Direction:
Attributes:
Legends:
Maximum surface wind speed (mi/hr) (Maxsfc_mph) - ranges from 17.3 ( ![]() ) to 90 (
) to 90 (![]() ) miles per hour.
) miles per hour.
Direction (azimuth) of max wind ranges from 0.05 (![]() ) to 360 (
) to 360 (![]() ) degrees around a circle.
) degrees around a circle.
ALI182012 is the Tropical Cyclone Report identifying code for Hurricane Sandy. AL stands for Atlantic and 182012 means that Sandy was the 18th named storm in 2012.
Other wind layers listed as date and time.
The times represent 3 hr intervals from 10/28/2012 through 10/30/2012.
Attributes:
Legend:
Surface wind speed (mi/hr) - ranges vary between dates and times, but green is the lowest ( ![]() ) and red is the highest (
) and red is the highest (![]() ).
).
Storm surge was created from field-verified High Water Marks (HWMs) and Storm Surge Sensor data from the USGS through February 14, 2013. HWMs and Surge Sensor data are used to interpolate a water surface elevation which was then subtracted from the best available DEM to create a depth grid and surge boundary by state. For Connecticut, the vertical value is water depth above the ground in feet.
Legend: Areas in green were impacted by storm surge. Although subtle, darker greens were more impacted while lighter greens were less impacted. Click on a location and then View Additional Details to see the pixel value which is the water depth above the ground in feet.
 Impact Rank. A composite of surge, wind, precipitation and precipitation impacts are used to assess impacts for each County. Surge is the primary driver of the severe impacts as a result of Hurricane Sandy. Relative impact assessment are defined as:
Attributes
Population, Households, Exposed Households - values derived by area weighting using the field-verified surge extents and 2010 census blocks.
Precipitation Rank. For rain are defined as:
Critical Infrastructure Exposure values are derived by a point based intersection method between the infrastructure and the surge extent. Critical infrastructure includes:
FEMA Declaration. FEMA Individual Assistance (IA) Household Inspection Damage Totals.
When a household applies for Individual Assistance (IA), FEMA inspectors conduct field inspections of damaged properties. FEMA inspectors estimate (1) the amount of Personal Property (contents) Full Verified Loss (FVL), (2) Real Property (home) FVL and (3) a sum of both reported as Total FVL. The household damage classification is reported using the following categories from Total FVL:
FEMA MOTF Hurricane Sandy Impact Analysis on ArcGIS Online