Connecticut Contours 2000 includes 2, 5, 10, 20, 50, and 100 ft elevation contour lines for Connecticut. This information replaces previously available statewide contour line information for 2000. The Connecticut Contours 2000 data contain fewer errors and data gaps than the Elevation Contours 2000 data previously used in CT ECO, however, some inaccuracies remain. The Connecticut Contours 2000 data also differ slightly in their overall appearance from the previous Elevation Contours 2000 data. The contour lines are smoother, less jagged and have been optimized for faster software drawing and cartographic display; and there is an additional 5ft contour line interval. What makes them different is how they were made. For example, the revised Connecticut Contours 2000 data are derived from a smoothed statewide 10-foot Digital Elevation Model (DEM) surface based on the Connecticut 2000 LiDAR ground elevation data, whereas the previously available contours were derived directly from the Connecticut 2000 LiDAR point dataset. The 10-foot DEM used to create these revised contour lines was developed by the Center for Land Use Education and Research (CLEAR).
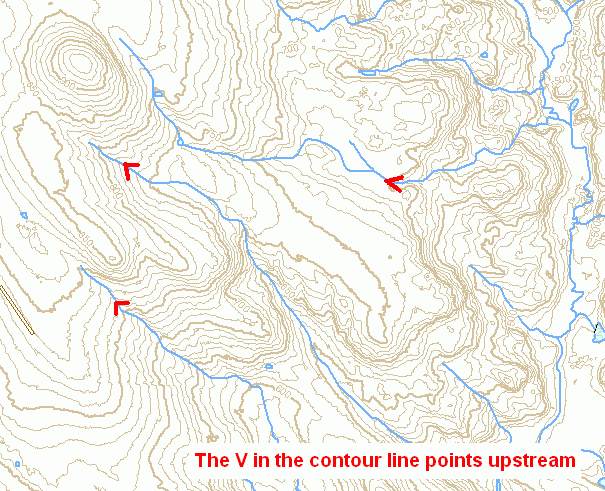
Contour lines are used to denote elevation above sea level. With this information, a general sense of the lay of the land, terrain or relief can be ascertained. Gentle sloops are characterized by widely spaced contour lines. Steep slopes are represented by closely spaced contour lines. Contour lines that cross streams flowing through valleys of noticeable relief will form a V-shaped deflection with the apex of the V pointing upstream. This is commonly known as the rule of V's.
.
Conecticut Contours 2000 data is only suitable for general planning and informational purposes. It is not intended for exact determinations of floodplain or other similar elevations where a detailed survey is normally required, for example. It is useful in obtaining a general understanding of the elevation for a particular area, but not suitable for detailed engineering, building and design purposes. The following limitations of the data sources used and the process performed to create the contour line features should be taken into consideration in determining whether this information appropriately meets a particular need. These contours are based on information from a statewide collection of ground elevation LiDAR data for the year 2000. LiDAR or Light Detection and Ranging is an optical remote sensing technology for measuring elevation, terrain, infrastructure and vegetation. The Connecticut LiDAR dataset for 2000 captured ground elevation every 20 feet (20-foot posting) at a horizontal accuracy of approximately 3 feet on the ground. For unknown reasons, LiDAR elevation data was not collected every 20 feet in some areas. This resulted in data gaps that affect the overall accuracy, completeness and appropriate use of data products like contours derived from the statewide LiDAR data. In an effort to make the available statewide elevation information more uniform and useful, the University of Connecticut, Center for Land Use Education and Research (CLEAR) created a more complete and accurate statewide 10-foot digital elevation model (DEM) for Connecticut by filling in the LiDAR data gaps with coarser point elevations based on information interpreted from contour lines on USGS 1:24,000-scale 7.5 minute topographic quadrangle maps. From this statewide 10-foot DEM, CT DEP created a smoother DEM specifically for deriving contour line information at 2, 5, 10, 20, 50, and 100 foot intervals. The resulting Connecticut Contours 2000 data align well with the previously available contour lines, and they are smoother, less jagged looking, and are generally more reliable in areas where there were gaps in the underlying LiDAR data.
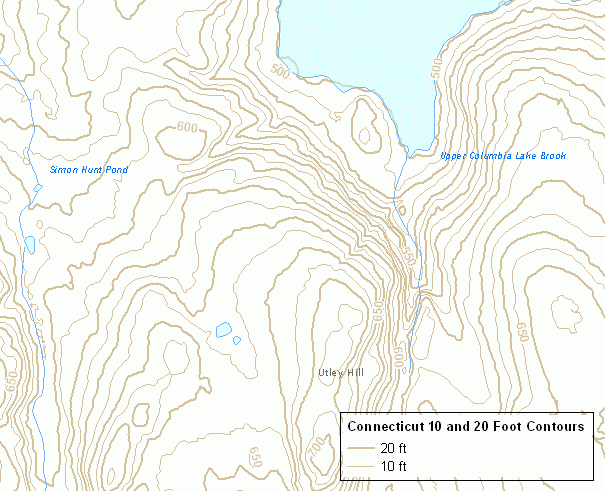
Connecticut Contours 2000, while less error-prone than the previous Elevation Contours 2000 data, should be used within the known limitations of the source data, processing or lack of additional information that would improve their quality. These contour lines do not respect all waterbody shorelines and are apt to erroneously extend into areas of water. Due to these and other anomalies, use caution when viewing and analyzing this information. Also, Connecticut Contours 2000 information may not align well with information compiled at less accurate map scales such as 1:24,000-scale based Connecticut Hydrography, Connecticut Waterbody, Connecticut Named Waterbody, and Connecticut Drainage Basins. River and stream features and watershed delineations that are based on USGS topographic quadrangle maps at 1:24,000-scale (1"=2,000') may not align exactly with the terrain of stream valleys and elevations of hills and ridges depicted by these contours. For example, there are sections in the streams shown in the small contour map at the top of this page that are not exactly located along the apex of the V-shaped Contour lines that cross them and define the stream valley.
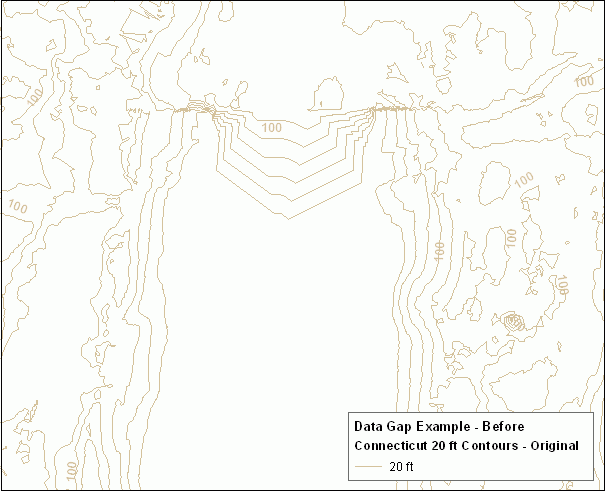
Figure 1 - Example of previous Elevation Contours 2000 showing angular nature of contour lines in a data gap area.
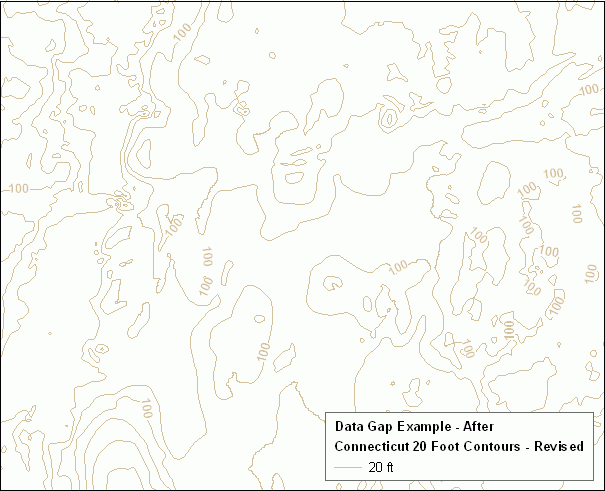
Figure 2 - Example of Connecticut Contours 2000 with contour lines fixed in the data gap area depicted in Figure 1.
This CT ECO data guide describes revised contour line data for Connecticut that replaces the Elevation Contours 2000 data previously used in CT ECO.