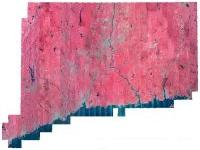
Connecticut 2010 NAIP Color Infrared Orthophotography is a statewide aerial survey of 2010, color infrared, leaf on, 1 meter ground sample distance imagery for Connecticut from the National Agriculture Imagery Program (NAIP). NAIP acquires digital ortho imagery during the agricultural growing seasons in the continental United States. A primary goal of the NAIP program is to enable availability of ortho imagery within one year of acquisition. NAIP is administered by the USDA's Farm Service Agency (FSA) through the Aerial Photography Field Office in Salt Lake City. This leaf-on imagery is captured during the peak growing season and used as a base layer for GIS programs in FSA's County Service Centers, and is used to maintain the Common Land Unit (CLU) boundaries. The ground resolution for this imagery is 3.39 feet (1 meter) per image pixel.
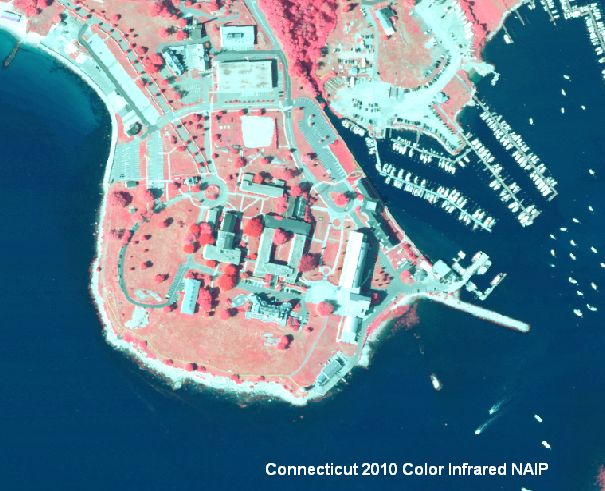
The 2010 NAIP imagery for Connecticut includes 4 color bands, allowing for the display and analysis in natural color or color infrared. The nearby example is in color infrared. This leaf-on, color infrared imagery serves a variety of purposes from observing vegetation and crop condition to supporting identification and mapping of habitat areas through photo interpretation. This orthophotography is ideal for observing crop condition.
The color infrared (CIR) imagery is useful for discerning features such as vegetation that give off a distinct signature in the infrared spectrum.
This statewide mosaic of 2010 orthophotography is not color balanced so tonal imbalances between individual input images are not corrected. As shown in the nearby example, the range and intensity of colors varies depending on the area viewed. For example, surface water bodies and and trees in the color infrared imagery appear in different intensities of blue and red across the state. Because the 2010 aerial photography was taken during the peak agricultural growing seaon, the tree canopy blocks the ground surface from view and creates shadows that also obscure nearby features. Also, the location and shape of features in other GIS data may not exactly match information shown in the 2010 aerial photography primarily due to differences in spatial accuracy and data collection dates. For example, a stream in the 1:24,000-scale Connecticut Hydrography data from CT DEP may not line up exactly with the watercourse shown in the 2010 aerial photography. Their location and shape are bound to be different because information such as hydrography compiled from older 1:24,000-scale USGS topographic quadrangle maps, lacks the spatial accuracy of and is less current than the 2010 orthophotography.