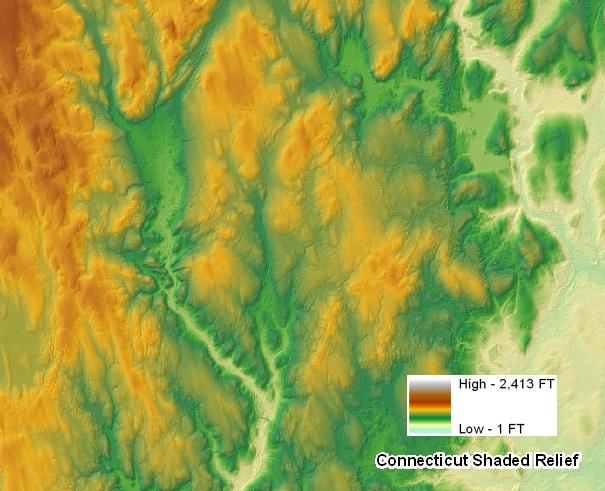
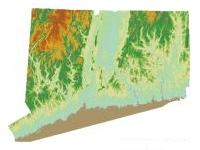
Shaded Relief 2000 generates the appearance of a three-dimensional representation of terrain that uses gradational shades of color rather than contour lines to depict elevation. Areas of low elevation in Connecticut are shown in light blue. Areas slightly higher in elevation are shown in light yellow, followed by green, orange, red, brown, gray, and white for the highest elevated areas in Connecticut. The three-dimensional effect is also achieved by showing shadows cast on high ground as if sunlight is shining from the northwestern direction. As a result, the northwestern side of elevated areas is intentionally lighter in color than the southeastern side. Relatively flat areas are not shadowed and appear smooth, whereas steeper slopes appear rough with the southeastern side appearing darker in color. The elevation colors shown on this map do not represent vegetation or climate regions. This shaded relief effect uses elevation and hillshade information for Connecticut obtained from the University of Connecticut, College of Agriculture and Natural Resources, Center for Land Use Education and Research (CLEAR). CLEAR derived this information from point elevation data for all of Connecticut that was captured in 2000 using Light Detection And Ranging (LiDAR) technology.
This information is used to cartographically depict topography at a regional level and not intended for use at detailed scales or to determine the exact elevation at a particular location.
This information may be incorrect in some areas due to gaps in the underlying point elevation LiDAR data used to generate the shaded relief effect. When displayed at a detailed map scale, the shaded relief may appear discontinuous and off color in areas where information is incorrect, and linear breaks in the shading may be apparent in areas where there are errors in the underlying elevation data. Due to these anomalies and inconsistencies, use caution when viewing and analyzing this informaiton.
Also, the location and shape of features in other GIS data may not exactly match the elevation suggested by the hillshade primarily due to differences in spatial accuracy and data collection dates. For example, a stream in the 1:24,000-scale Connecticut Hydrography data from CT DEEP may not line up exactly with the inferred stream bank suggested by the shaded relief information. Their location and shape are bound to be different because information such as hydrography compiled from older 1:24,000-scale USGS topographic quadrangle maps, lacks the spatial accuracy of and is less current than the elevation data captured in 2000.
Ground Elevation data and Hillshade data are used to generate the appearance of a three-dimensional (shaded relief) representation of terrain.